|
Taskflow
3.2.0-Master-Branch
|
|
Taskflow
3.2.0-Master-Branch
|
class to create an observer based on the built-in taskflow profiler format More...
#include <observer.hpp>

Public Member Functions | |
| void | dump (std::ostream &ostream) const |
| dumps the timelines into a Taskflow Profiler format through an output stream | |
| std::string | dump () const |
| dumps the timelines into a JSON string | |
| void | clear () |
| clears the timeline data | |
| size_t | num_tasks () const |
| queries the number of tasks observed | |
 Public Member Functions inherited from tf::ObserverInterface Public Member Functions inherited from tf::ObserverInterface | |
| virtual | ~ObserverInterface ()=default |
| virtual destructor | |
Friends | |
| class | Executor |
| class | TFProfManager |
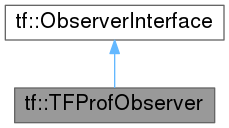
class to create an observer based on the built-in taskflow profiler format
A tf::TFProfObserver inherits tf::ObserverInterface and defines methods to dump the observed thread activities into a format that can be visualized through Taskflow Profiler.
We recommend using our Taskflow Profiler python script to observe thread activities instead of the raw function call. The script will turn on environment variables needed for observing all executors in a taskflow program and dump the result to a valid, clean JSON file compatible with the format of Taskflow Profiler.