|
Taskflow
3.2.0-Master-Branch
|
|
Taskflow
3.2.0-Master-Branch
|
Taskflow comes with a built-in profiler, TFProf, for you to profile and visualize taskflow programs.
All taskflow programs come with a lightweight profiling module to observer worker activities in every executor. To enable the profiler, set the environment variable TF_ENABLE_PROFILER to a file name in which the profiling result will be stored.
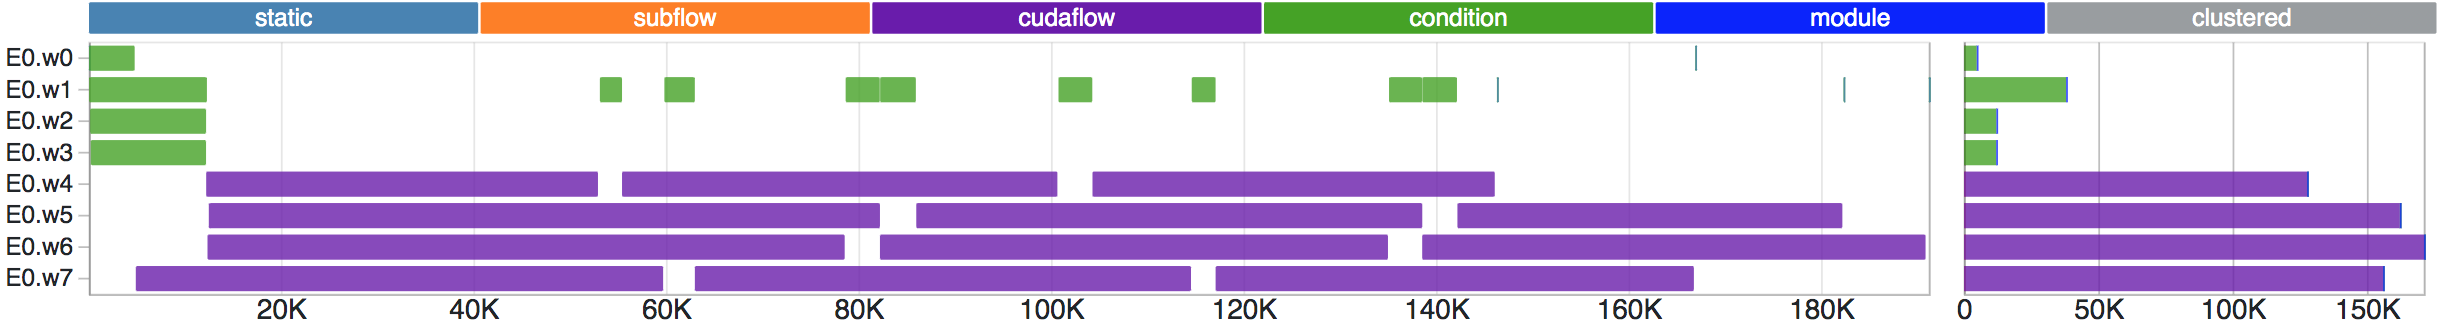
When the program finishes, it generates and saves the profiling data to result.json in JavaScript Object Notation (JSON) format. You can then paste the JSON data to our web-based interface, Taskflow Profiler, to visualize the execution timelines of tasks and workers. The web interface supports the following features:
TFProf implements a clustering-based algorithm to efficiently visualize tasks and their execution timelines in a browser. Without losing much visual accuracy, each clustered task indicates a group of adjacent tasks clustered by the algorithm, and you can zoom in to see these tasks.